iOS Swift Tutorial: Fitness tracking and iOS charts

<Image alt="UITableView Delegate and Datasource in Swift" objectFit="contain" src="/static/images/sc61.png" height={300} width={1000} placeholder="blur" quality={100} />
In the previous tutorial, we found how to use the CMPedometer and CMActivityManager to fetch the fitness tracking metrics like number of steps and the current activity state.
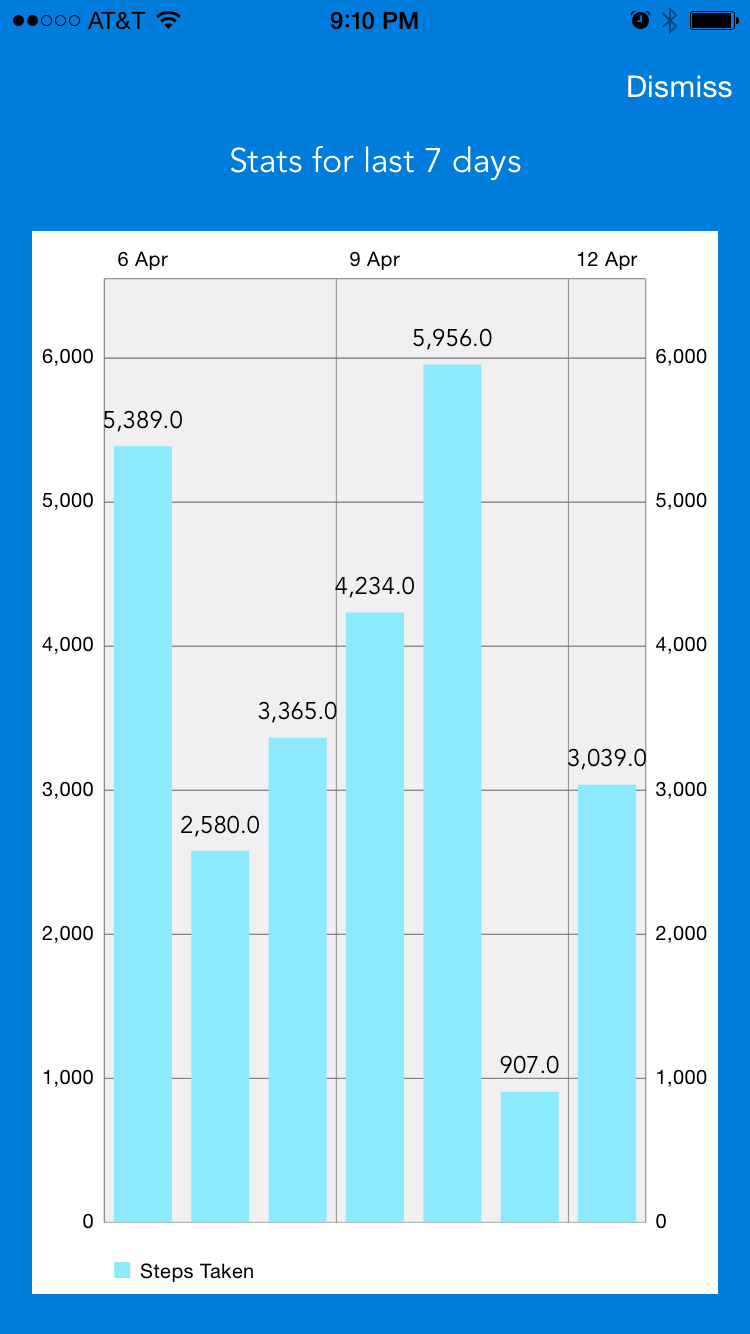
This is how the graph will look
<Image alt="UITableView Delegate and Datasource in Swift" objectFit="contain" src="/static/images/sc6.png" height={300} width={1000} placeholder="blur" quality={100} />

Let us look at the change in the main storyboard from the previous tutorial
-
First create a new file called ChartViewController.Swift which is a subtype of UIViewController. (File New -> iOS Source -> Cocoa Touch Class)
-
In the identity inspector set the type to ChartViewController[su_divider]

<Image alt="UITableView Delegate and Datasource in Swift" objectFit="contain" src="/static/images/sc5.png" height={300} width={1000} placeholder="blur" quality={100} />
-
Add a button
dismissto the viewcontroller -
Create a
IBActionfrom dismiss to the ChartViewController( Use the CTRL+Drag trick. CTRL+DRAG from dismiss button to the ChartViewController) -
Drag a
UIViewfrom the object library on to the ChartViewController and setup the autolayout constraints as below
<Image alt="UITableView Delegate and Datasource in Swift" objectFit="contain" src="/static/images/sc4.png" height={300} width={1000} placeholder="blur" quality={100} />
-
Select the
UIViewgo to Identity inspector and change the Class toBarChartView.
<Image alt="UITableView Delegate and Datasource in Swift" objectFit="contain" src="/static/images/sc3.png" height={300} width={1000} placeholder="blur" quality={100} />
-
CTRL+DRAG from uiview on to the ChartViewController and create a IBOutlet with name as
chartView
What would be really nice is if we can track how many steps we have taken over the last 7 days. We will be using pedoMeter.queryPedometerDataFromDate(fromDate, toDate: toDate) over the last 7 days and group by the day to find how many steps we have been taking daily.
Since queryPedoMeter is async and we need to fetch data over the last 7 days it’s quite possible that the data might not be fetched by the time the view is loaded. One way to get around this problem is to reload the views when all the data is fetched.
One key point to note is that we should not be performing any operations which are time consuming in the main thread which handle all the touch events, otherwise the app will become sluggish. Apple has provided us with a mechanism to get around this problem using Grand Central Dispatch.
Some of the feature provided by GCD aka(Grand Central Dispatch) are queues and blocks. There are different type of queues
- Main Queue : The main queue is automatically created by the system and associated with your application’s main thread. Your application uses one (and only one) of the following three approaches to invoke blocks submitted to the main queue:
- Calling dispatch_main
- Calling UIApplicationMain (iOS) or NSApplicationMain (OS X)
- Using a CFRunLoopRef on the main threadWe can get access to the main queue by using dispatch_get_main_queue()
- Global Concurrent Queue
- Serial Queue
Global Concurrent queue and Serial queue differ in the way the blocks are processed. As you may have guessed Concurrent queue execute in parallel where as in Serial Queue the blocks are processed in the way they are submitted to the queue.
There are different ways in which blocks can be submitted to either of these queues. There are two main types dispatch_async and dispatch_sync.
dispatch_async submits the blocks and returns immediately where as dispatch_sync will wait till the block is completed.
Once we fetch the data we need to show the graph of the trend. We will be using iOS Charts to display a bar graph.
Add it to the podfile and perform pod install. Does pod install sounds like greek and latin to you? If so please take a look at this tutorial before continuing Pod dependency manager
Lets looks at the code.
//
//  ChartViewController.swift
//  Steps
//
//  Created by Shrikar Archak on 4/11/15.
//  Copyright (c) 2015 Shrikar Archak. All rights reserved.
//

import UIKit
import Charts
import CoreMotion

class ChartViewController: UIViewController, ChartViewDelegate {

    @IBOutlet weak var chartView: BarChartView!
    var days:\[String\] = \[\]
    var stepsTaken:\[Int\] = \[\]
    let activityManager = CMMotionActivityManager()
    let pedoMeter = CMPedometer()

    var cnt = 0
    override func viewDidLoad() {
        super.viewDidLoad()
        chartView.delegate = self;

        chartView.descriptionText = "";
        chartView.noDataTextDescription = "Data will be loaded soon."

        chartView.drawBarShadowEnabled = false
        chartView.drawValueAboveBarEnabled = true

        chartView.maxVisibleValueCount = 60
        chartView.pinchZoomEnabled = false
        chartView.drawGridBackgroundEnabled = true
        chartView.drawBordersEnabled = false

        getDataForLastWeek()
    }

    override func didReceiveMemoryWarning() {
        super.didReceiveMemoryWarning()
    }

    @IBAction func dismiss(sender: AnyObject) {
        self.dismissViewControllerAnimated(true, completion: nil)
    }

    func getDataForLastWeek() {
        if(CMPedometer.isStepCountingAvailable()){
            var serialQueue : dispatch\_queue\_t  = dispatch\_queue\_create("com.example.MyQueue", nil)

            let formatter = NSDateFormatter()
            formatter.dateFormat = "d MMM"
            dispatch\_sync(serialQueue, { () -> Void in
                let today = NSDate()
                for day in 0...6{
                    let fromDate = NSDate(timeIntervalSinceNow: Double(-7+day) \* 86400)
                    let toDate = NSDate(timeIntervalSinceNow: Double(-7+day+1) \* 86400)
                    let dtStr = formatter.stringFromDate(toDate)
                    self.pedoMeter.queryPedometerDataFromDate(fromDate, toDate: toDate) { (data : CMPedometerData!, error) -> Void in
                        if(error == nil){
                            println("\\(dtStr) : \\(data.numberOfSteps)")
                            self.days.append(dtStr)
                            self.stepsTaken.append(Int(data.numberOfSteps))
                            println("Days :\\(self.days)")
                            println("Steps :\\(self.stepsTaken)")
                            if(self.days.count == 7){
                                dispatch\_sync(dispatch\_get\_main\_queue(), { () -> Void in
                                    let xVals = self.days
                                    var yVals: \[BarChartDataEntry\] = \[\]
                                    for idx in 0...6 {
                                        yVals.append(BarChartDataEntry(value: Float(self.stepsTaken\[idx\]), xIndex: idx))
                                    }
                                    println("Days :\\(self.days)")
                                    println("Steps :\\(self.stepsTaken)")

                                    let set1 = BarChartDataSet(yVals: yVals, label: "Steps Taken")
                                    set1.barSpace = 0.25

                                    let data = BarChartData(xVals: xVals, dataSet: set1)
                                    data.setValueFont(UIFont(name: "Avenir", size: 12))
                                    self.chartView.data = data
                                    self.view.reloadInputViews()
                                })

                            }
                        }
                    }

                }

            })
        }
    }

}
Most of the code in the viewDidLoad is setting up the chart view to display the graph. On line 115 we create a serial queue. The nil indicated that we are creating a serial queue. Line 120-125 we just fetch the pedometer data grouped by each day. The self.days variable will hold the day for which we will be showing the step count and the self.stepsTaken will have the actual count. Once we have fetched all the data (when the self.days.count == 0). We setup the data for the chartView and reloadInputViews in the main queue. You might be wondering why we didn’t execute on the queue which we created, the reason being any update to the View should be done in the main queue.